
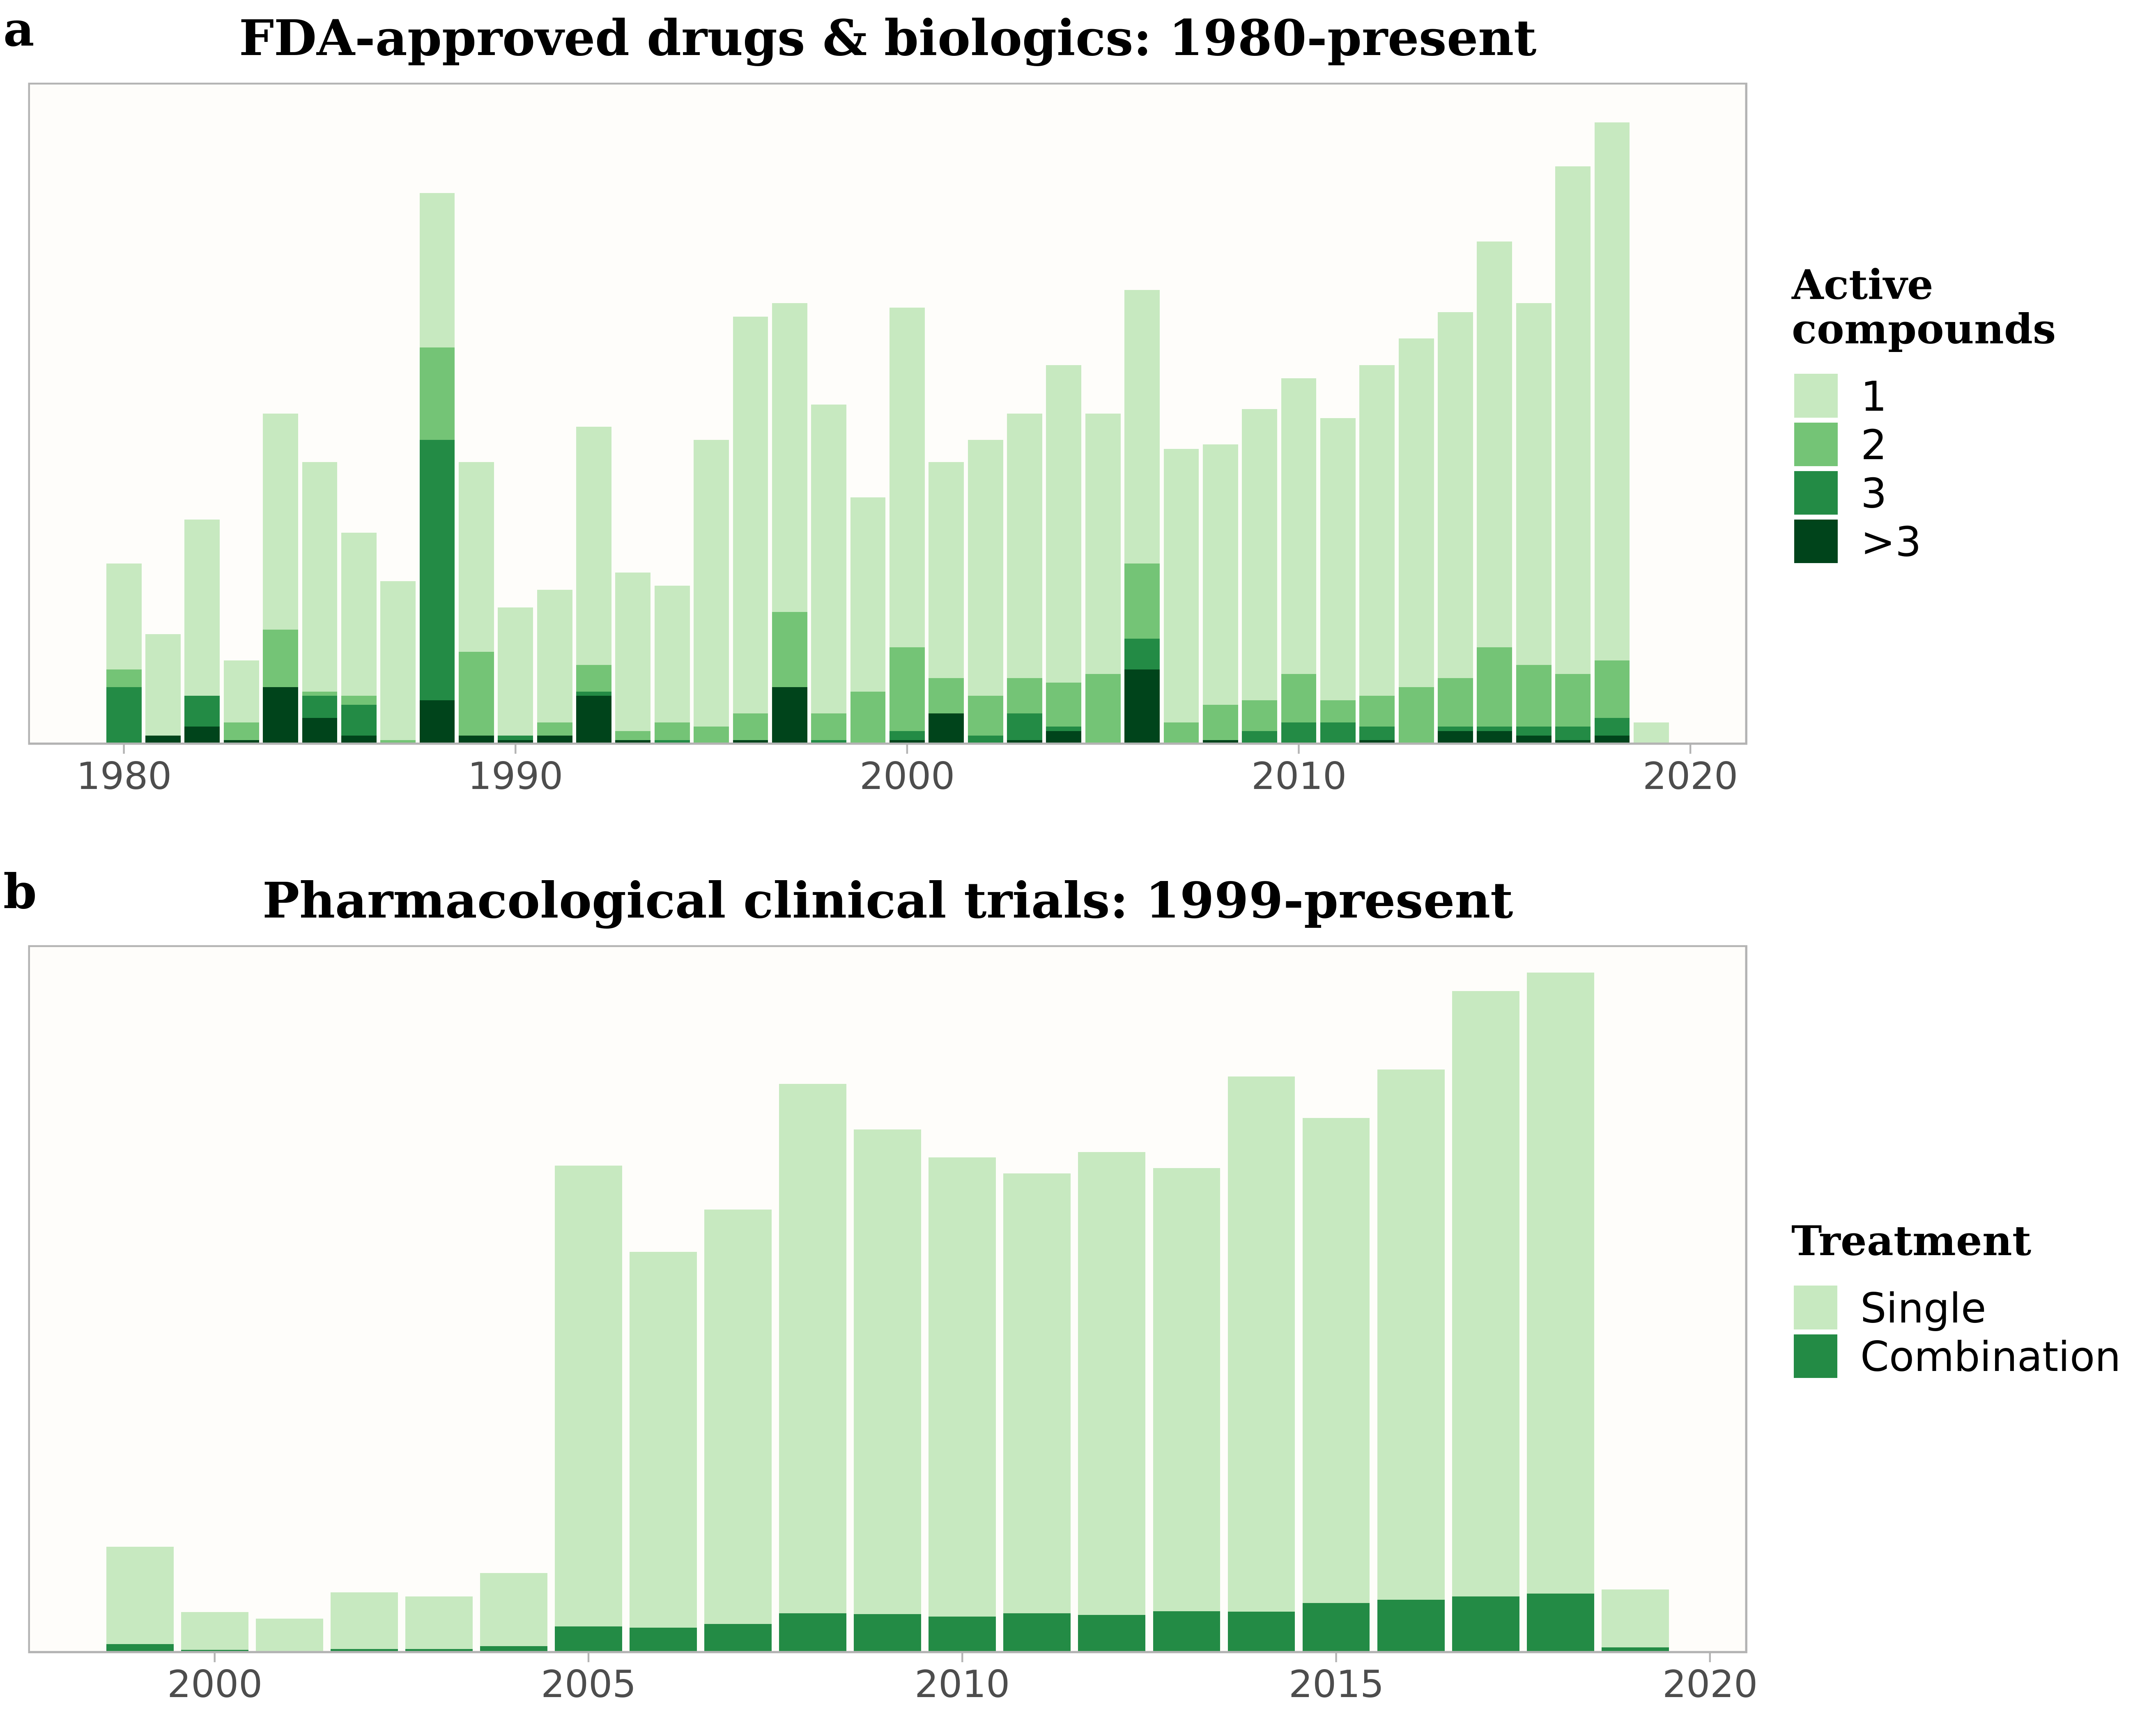
FDA Drug Approvals and Combination Therapies
Question: How many FDA-approved therapies consist of multiple active chemicals or biologics, and how many clinical trials employ combination treatments?
Rationale: The most effective strategies to curb the rise of cardiometabolic diseases in the late 20th century focused on single risk factors. Population-level blood pressure and cholesterol, for instance, decreased in large part from pharmaceuticals. The returns on these innovations now appear to be diminishing: obesity rates continue to rise, and gains in healthy life expectancy trail that of total life expectancy. If these patterns reflect a broader depiction of the modern human condition, then we should question if such complex challenges can be addressed through such focused countermeasures. The primary question of interest here is how many approved therapies consist of multiple active chemicals or biologics.
Procedure: Drugs@FDA is queried with filters on drugs which are original Submissions, Prescription or Over the Counter Status, and an ANDA, NDA or BLA Application type. Clinical trial metadata is queried with filters on trials that are Not Yet Recruiting, Recruiting, Enrolling, Active, or Not Recruiting, and where Age Group is greater than 18, and an Interventional Study Type. A keyword search for “combination” is performed in the study description.
Results and Conclusions: The majority of FDA-approved drugs consist of one active compound, and clinical trials are predominantly single drug interventions. Two primary forces likely drive this effect. The first is rooted in the overtly reductionist framework in biomedical research. Therapeutic-oriented research is primarily concerned with a one-at-a-time functional assessment, such as the role of a single protein in a signaling pathway, or single nucleotide polymorphism genotype-phenotype relationships. The second force is both the complexity and challenge in both designing and gaining approval for combination therapies. Combination therapy trials require more human subjects and cost, and must demonstrate greater efficacy over single therapies to win approval. Despite these challenges, there does appear to be a trend towards greater therapeutic complexity in recent years. This effect may highlight encouraging shifts in systems-level thinking in translational research and an innovative drive towards more effective therapies against hard-to-treat chronic conditions.
Anti-aging and Diet Mimetics Through Metabolic Modeling
Scope: “Health” is a nebulous term used liberally in both scientific and laymens audiences. Across both arenas, there is consensus that there can be relatively “good” and “poor” health, and there is tremendous focus on deriving singular drugs, optimal diets, or performant workouts which improve health or extend lifespan. The expectation that one drug can dramatically alter physiology permeates scientific research, but optimal diets and lifestyle are more likely to improve health. This goal may first require a commensurately complex analysis of physiology before understanding how to change it. The objective here is to computationally model the entirety of an organism’s physiology and predict interventions to invoke a “healthier” state.
This work was performed under the entity Robur Health, a venture which I did not deem sufficiently de-risked to advance this platform for drug discovery, nor perform experimental validation of this algorithm’s hypotheses. This approach may yet have applications in the therapeutic arena, or may advance its existing usage in bioengineering.
Summary of Findings and Discussion*: Metabolic modeling is an established approach to engineer microbes and yeast for industrial chemical, therapeutic, and food and beverage production. This work applied these methods to more complex biological systems to generate hypotheses for therapeutic discovery or for chemical agents, diets, and regimens which might mimic youthful or metabolically healthy phenotypes. The integration of publicly available gene expression data in worms produced metabolic signatures which corroborate prior work in longevity research. Anti-aging phenotypes served as an accessible proof-of-concept for this approach, however presents a more challenging objective in mammalian systems. To this end, a broader search of physiological mimetics was extended to diets and fasting regimens. These predictions did not yield clear hypotheses for fasting mimetics, with conflicting results from both fasted and fatty liver phenotypes. One main explanation for these findings may be due to an incomplete and inaccurate metabolic model. As an analogy, estimating the rate of traffic on a complete map of streets and highways is considerably easier than if the map were half complete. Since this work, better models have been created, and may advance the predictive ability of this approach. Until accurate maps of such complex biological systems can be created, the utility of metabolic modeling may continue to reside in simpler systems.
*Full report and research can be found Here
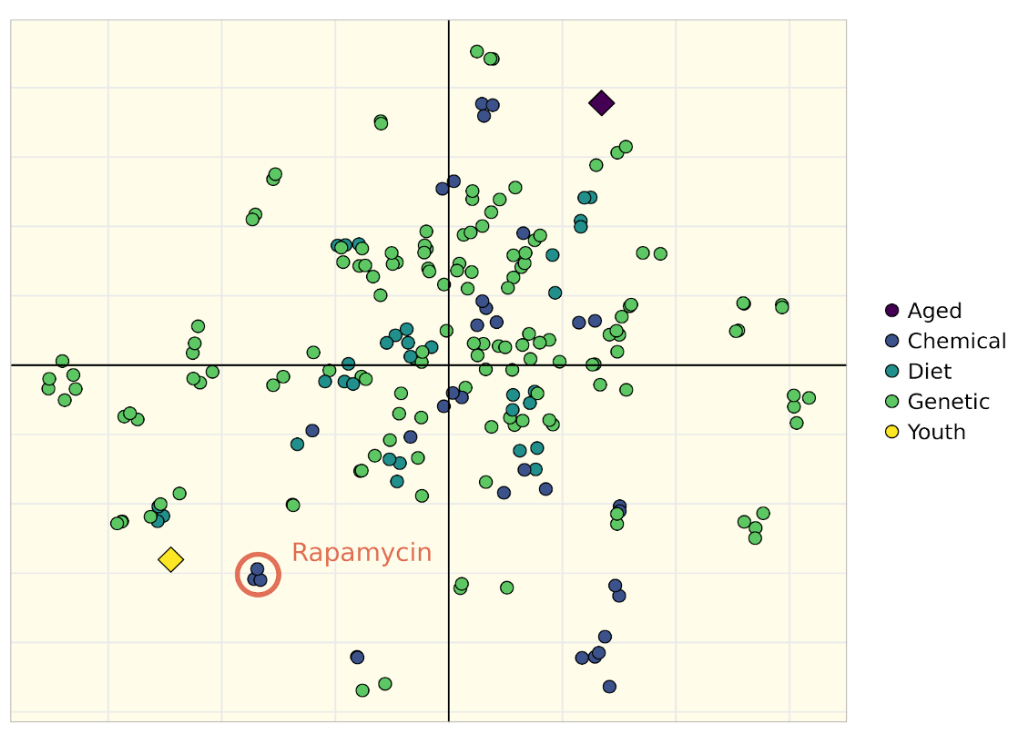
Low-dimensional representation of differential metabolic activity across experimental designs in worms. Axes represent the first two embeddings from t-SNE. Interventions were categorically assigned to age, genetic (knockouts and knockdowns), diet, or chemical exposure. Young (yellow) and old (dark blue) worms noted with diamonds.
Research Collaboration Networks
Objective: Query and visualizaton of research collaborations in published and pre-print articles
Rationale: Locating experts in a field of study is potentially useful for multiple reasons. One application is to identify potential collaborations or prototypes for technical or scientific platforms and products. Another application is to quickly learn a topic and state-of-the-art. Note the assumption herein: “experts” are correlated with number of publications, citations, and collaborators, which is not always the case in academic research.
Procedure: Query author names in PubMed and Arxiv. Create lists of papers, co-authors, and the edges and nodes between collaborating authors. Then create a network graph visualization.
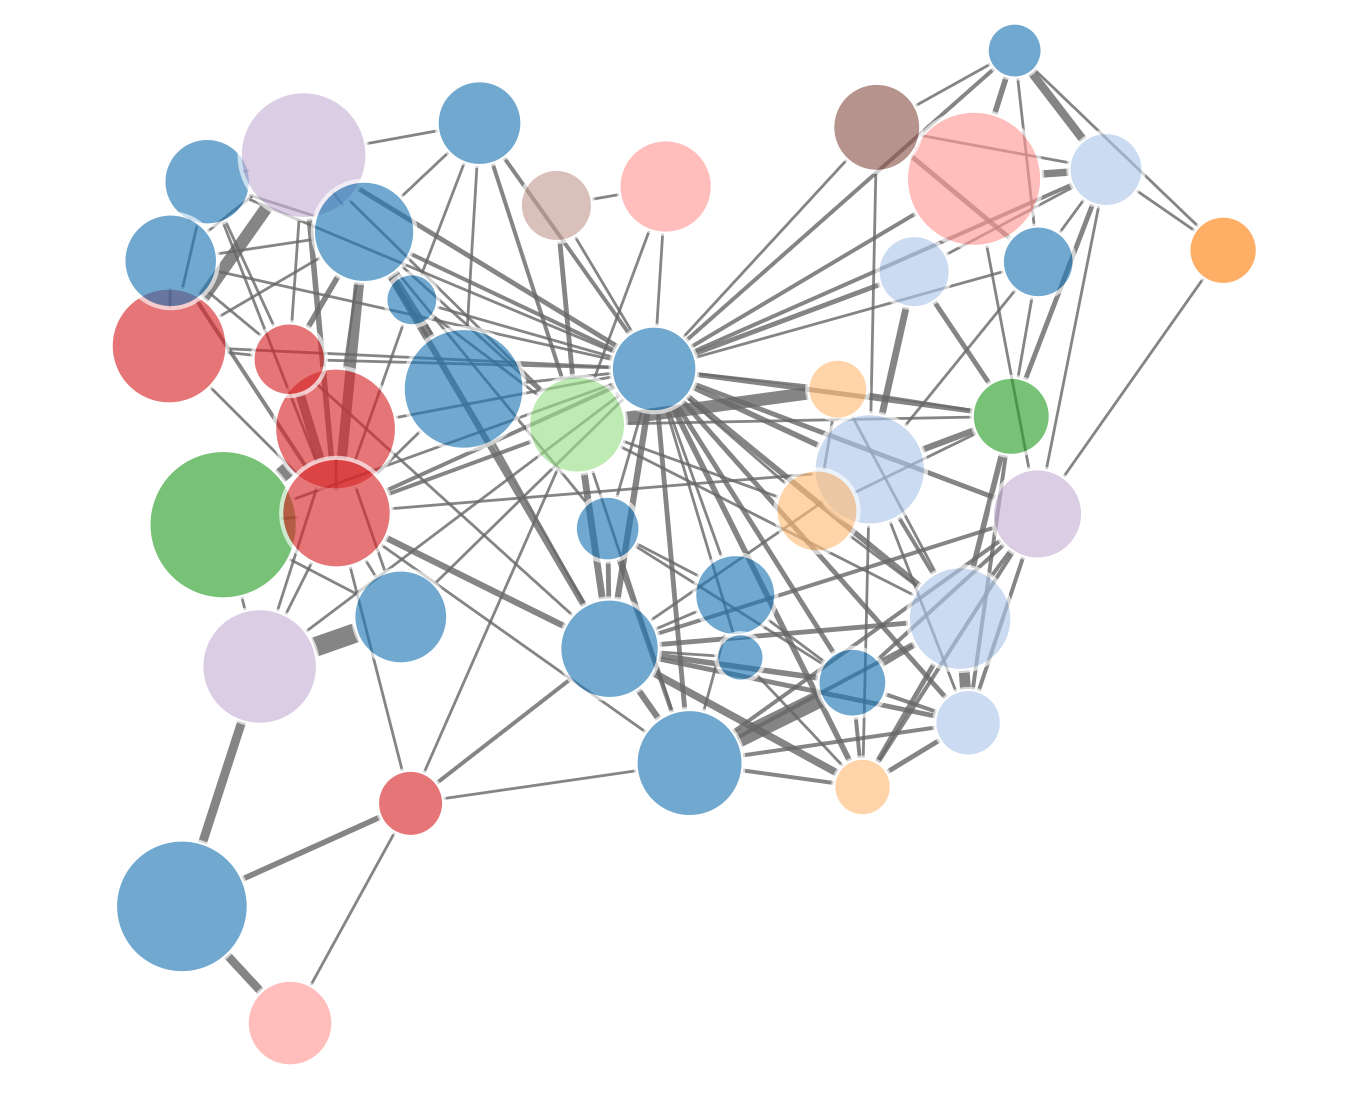
My (small) collaboration network. Edges are number of papers, nodes represent unique authors
Likelihood of Weight Change Over Time
Question: How likely is it that someone can return to normal weight, once that person enters an obese state? Or framed as a Markov Chain, is obesity an absorbing state, where an individual cannot return to normal weight?
Rationale: Population health trends are typically observed through cross-sectional analysis. While this analysis is useful from a macroscopic perspective, it cannot capture the granularity of an individual’s health across time. The distinction between individual health states over the time dimension, and population level cross-sectional observations, is helpful to clarify how one can improve the human condition. For example, rates of obesity have risen in the past decades. If the reversibility of obesity is likely, then the rise of obesity may be more attributable to insufficient or inaccessible treatment for those who remain obese. If reversbility of obesity is unlikely, then the rise of obesity may be more attributable to ineffective treatments.
Procedure: The National Longitudinal Survey of Youth 1997 (NLSY97) is part of the National Longitudinal Surveys (NLS) program. This particular cohort consists of individuals born between 1980 and 1984, and consist of 51% males, 49% females with diverse backgrounds (52% Non-black/Non-Hispanic, 26% Black Non-Hispanic, and 21% Hispanic). At the time of first interview, respondents' ages ranged from 12 to 18. The respondents were 30 to 36 at the time of their round 17 interviews in 2015-2016. Data was accessed from the NLS Investigator portal.
To categorize BMI as underweight, normal, overweight, or obese in non-adults, BMI-for-age charts were accessed from the CDC. BMI was calculated for each individual in the NLYS97 cohort (weight/height^2). For ages less than 20 years, BMI percentiles were taken from the CDC’s BMI-for-age charts. Underweight BMI was categorized as less than then 5th percentile for non-adults and less than 18.5 BMI for adults. Normal weight BMI was categorized as between the 5th and 85th percentiles for non-adults and between 18.5 and 25 for adults. Overweight BMI was categorized as between the 85th and 95th percentiles for non-adults and between 25 and 30 for adults. Obese BMI was categorized as above the 95th percentile for non-adults and above 30 for adults. After extracting BMI for each individual’s life-year, counts were enumerated for each one-to-any transition of weight strata (e.g. number of normal weight individuals at age 13 who enter an underweight, normal, overweight, or obese state at age 14). These counts were then normalized by the total individuals in that life year, by gender.
Results and Conclusions: Conditional on weight strata, for both males and females, the transitions between normal and overweight, and overweight and obese were more dynamic during adolescence. For instance, at age 15, 5% of normal weight females transitioned to overweight status at age 16, while 32.1% of overweight females transitioned to normal weight (7.5% and 31.1% for males, respectively). 17.1% of overweight females transitioned to obese, compared to 21% from obese to overweight (16.9% and 18.8% for males, respectively). 92.6% of females remain normal weight, 50.7% remain overweight, and 42.8% remain obese (90.8%, 51.9%, and 77.1% respectively in males). At age 25, the difference in transition rates decreased. 11.2% of normal weight females transitioned to overweight at age 26, while 20% of overweight females transitioned to normal weight (13.5% and 9.1% for males, respectively). 17% of overweight females transitioned to obese, compared to 8.4% from obese to overweight (10% and 13% in males, respectively).
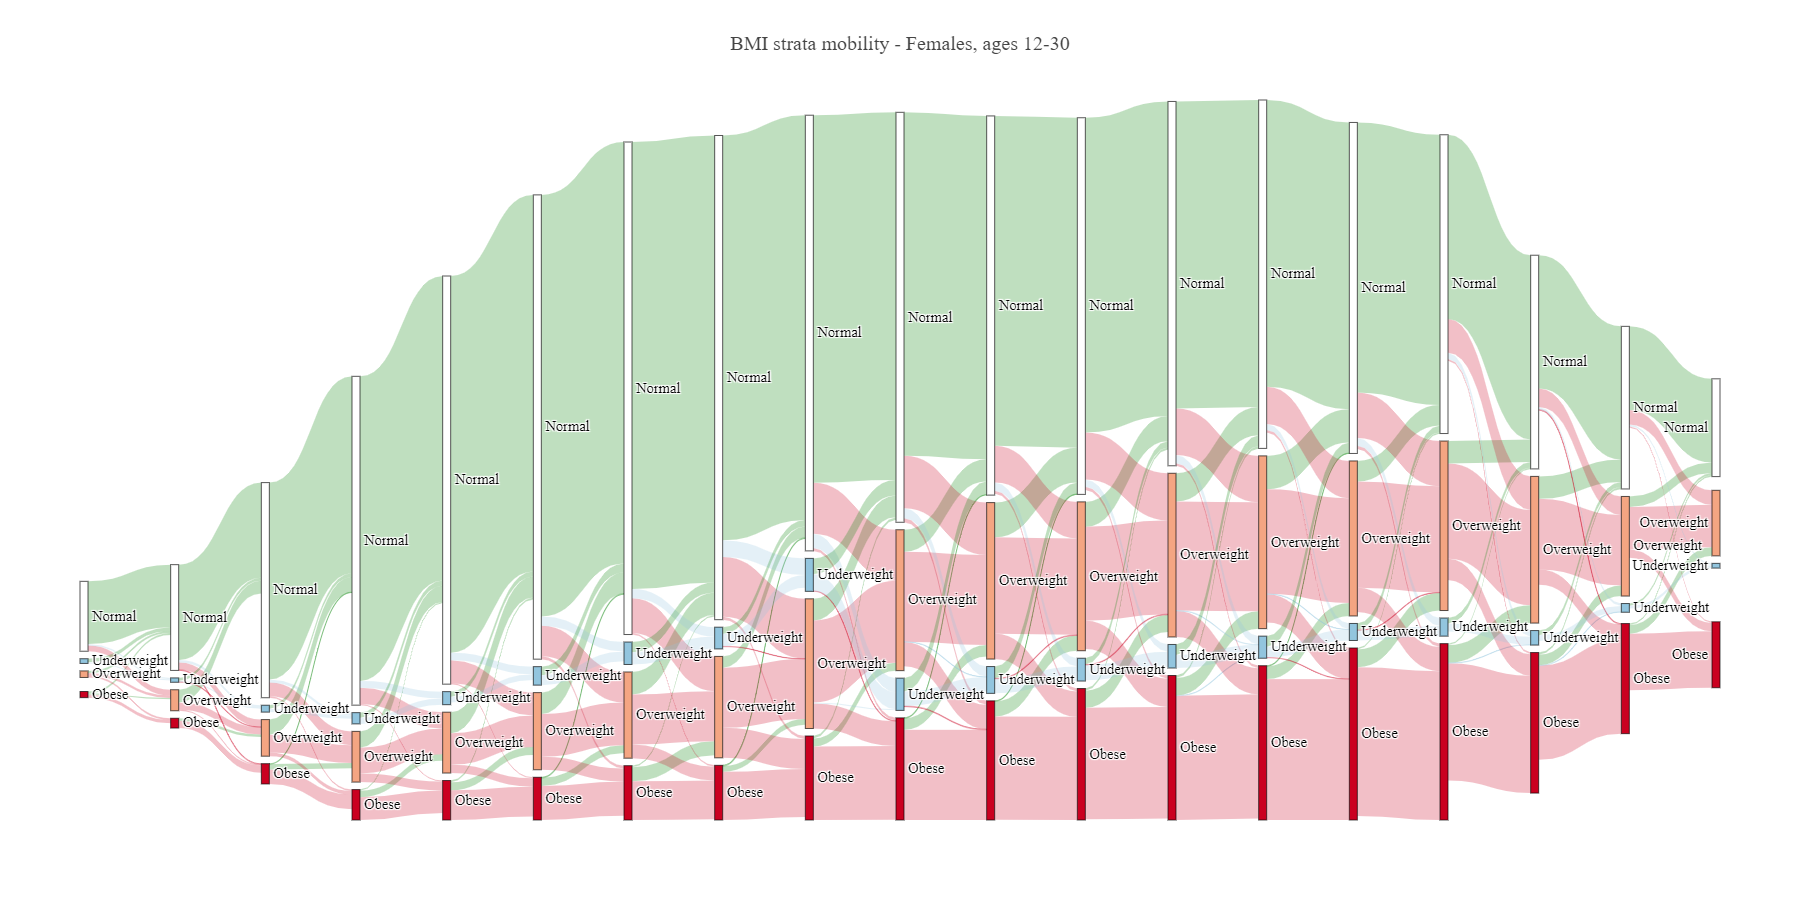
Figure 2. BMI in females, ages 12-30. Normal BMI in white, underweight BMI in blue. Each column represents one age-year. Data is represented as total counts, and thus reflects growing and shrinking cohort sizes throughout the study
In conclusion, the transition probabilties between weight strata is more evenly distributed during adolescence. However, by adulthood, these states are more absorbing, where overweight or obsese individuals are more likely to maintain their weight status. In general, these probabilities are less favorable for males than females. Importantly, when analyzing health trajectories on an individual basis, ergodicity should not be assumed. Weight maintenance, and the proper education and intervention (when truly necessary) should be stressed during adolescence, as the challenge of altering weight in adulthood is generally greater. Importantly, these unfavorable transition rates shed light on a need for more effective interventions.
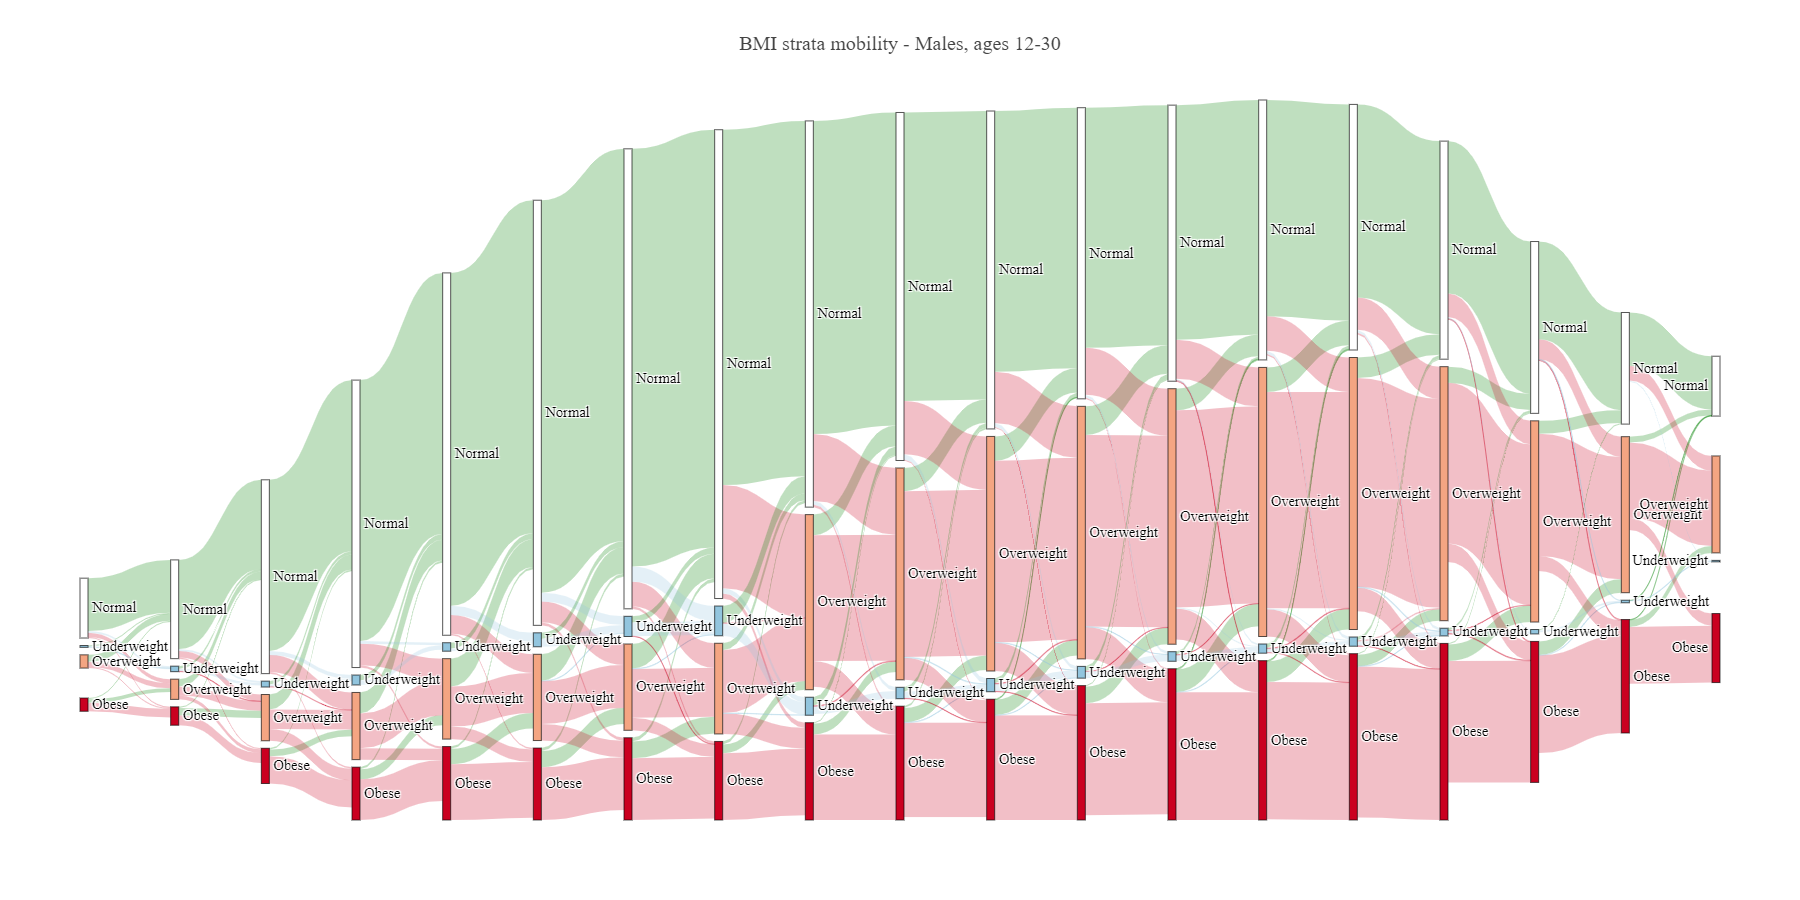
Figure 2. BMI in males, ages 12-30. Normal BMI in white, underweight BMI in blue. Each column represents one age-year. Data is represented as total counts, and thus reflects growing and shrinking cohort sizes throughout the study